
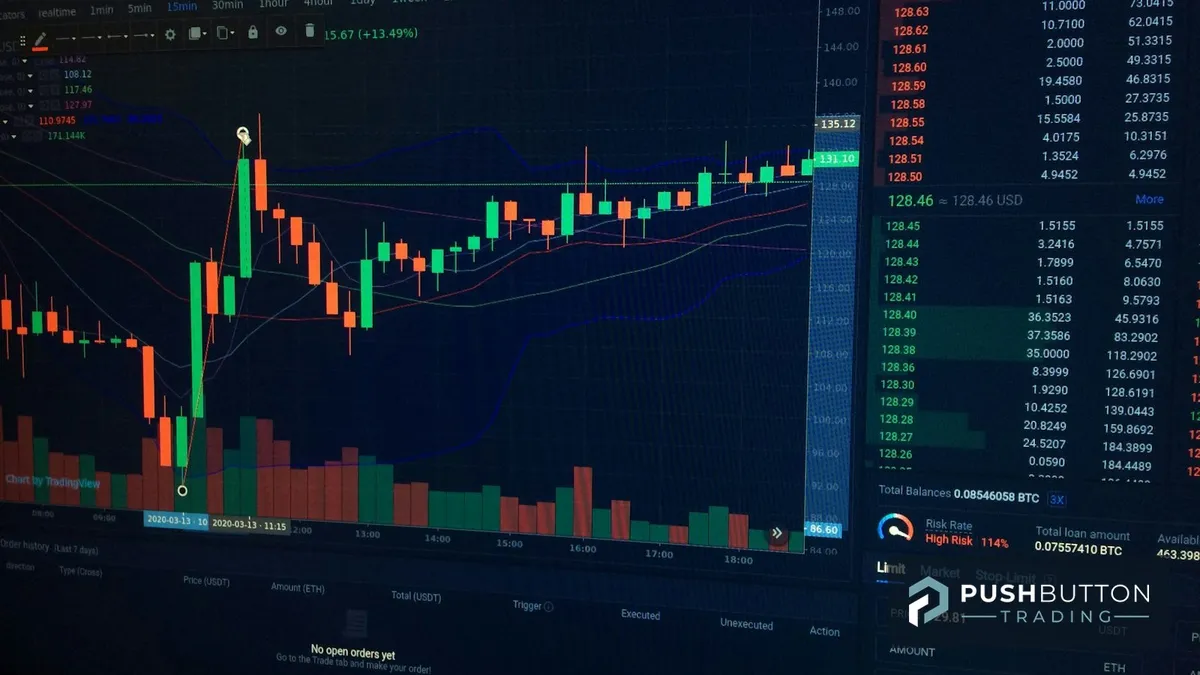
One Strategy, Two Timeframes: Why the Same NinjaTrader Bot on a 1-Minute and 5-Minute Chart Isn't Real Diversification
Here's a question that trips up a lot of traders building their first bot portfolio: if you take one automated strategy — say an ORB breakout — and run it on both a 1-minute chart and a 5-minute chart, have you actually diversified anything? It feels like you have. Two charts, two timeframes, two sets of signals firing at different moments. But under the hood, you've just bought two tickets to the same show.
Same Logic, Different Clock Speed
An automated strategy is a set of rules: what counts as a signal, where the stop goes, where the target sits, how size is calculated. None of that changes when you move from a 1-minute chart to a 5-minute chart — only the sampling rate of the price data feeding those rules changes. The bot is still asking the same question, just checking in more or less often to ask it.
That matters because the market conditions that make an ORB bot's breakout logic work — or fail — don't care what timeframe you're watching. A choppy, range-bound morning session will chop up both your 1-minute and 5-minute versions of the same strategy. A clean trending move will carry both of them. You haven't added a second opinion to your portfolio. You've added an echo.
Where the Correlation Actually Shows Up
The tell is in your equity curve, not your chart layout. Pull up the trade log for a strategy run across two timeframes on the same instrument and you'll usually find the losing days line up almost exactly — the 5-minute version might catch a slightly later entry or clip a few ticks off the stop, but the win/loss pattern tracks the same underlying price action. Real diversification means your bots are losing on different days for different reasons: a breakout bot bleeding in chop while a mean-reversion bot is quietly printing, or a volume-driven bot sitting out entirely while a trend bot works. Two timeframes of the same strategy almost never buys you that.
This is the same correlation risk that shows up when stacking multiple bots in a portfolio without checking how they overlap — except here it's disguised as "two separate tools" when it's really one tool run twice.
When Multiple Timeframes Actually Do Something Useful
There's a legitimate reason to look at more than one timeframe, and it's not diversification — it's confirmation or filtering. Some traders use a higher timeframe (say, a 15-minute or hourly read) purely as a gate: only let the fast strategy fire if the slower timeframe agrees on direction. That's a different job than running the same strategy twice and calling it two systems. One is a filter layered on top of a single strategy. The other is the illusion of two strategies that are really one position sized twice.
If your goal with automation is to actually spread risk across different market behaviors — not just different chart windows — the diversification has to come from the strategy's underlying logic, not its sampling interval: breakout logic paired with mean-reversion logic, or a volume-driven entry paired with a time-based one.
What to Check in Your Own Portfolio
If you're running the same automated strategy across more than one timeframe on the same instrument right now, pull the trade history for each and look at daily P&L side by side. If the red days match up more often than not, you're not running two bots — you're running one bot with a leveraged version of its own risk. That's worth knowing before a losing week hits both "versions" of the strategy at once and does twice the damage you budgeted for.
Push Button Trading's bot lineup is built around genuinely different logic — breakout, mean-reversion, and volume-driven strategies — so you can combine bots that actually behave differently in different market regimes instead of stacking copies of the same idea. Explore the full bot portfolio and see which combinations are built to diversify, not duplicate, at pushbuttontrading.co.